
Though rosy stats from the likes of Apple, Alphabet and Facebook Inc. about their mobile user and/or revenue growth can make it seem as if smartphone app usage is a runaway freight train, things are a little more complicated when you take a birds-eye view of the proverbial "app economy," as research firm comScore just did in its latest report on U.S. mobile app usage.
As comScore's numbers show, some mobile trends look much stronger than others, and some are healthy for certain demographics and weak for others. Here are some important takeaways for publicly-traded tech and Internet companies.
- Smartphone apps are in a league of their own when it comes to time spent.
comScore's data indicates smartphones accounted for 57% of all U.S. digital media time spent in June, with smartphone apps accounting for 50% and smartphone web browsing 7%. PCs now account for just 34% of time spent, and tablets just 9%. On average, U.S. consumers now spend 2.3 hours per day using apps, with younger demographic groups spending more time and older ones less.
It's worth adding that smartphones likely make up an even larger percentage of digital time spent in foreign markets where PC home and work penetration rates are lower. That said, PCs still account for a pretty large percentage of time spent on certain activities, such as online shopping and watching longer videos.
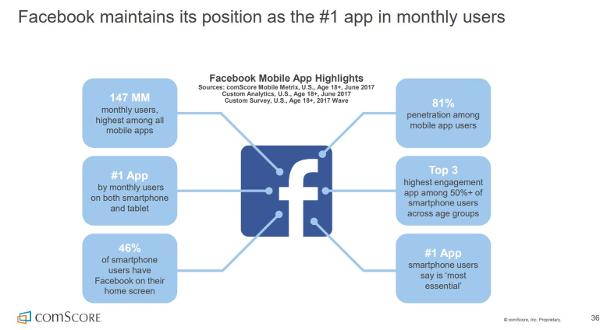
- Facebook and Google's most popular apps are as dominant as ever.
With the exception of Snap Inc.'s (SNAP) Snapchat, which came in at #7, Facebook and Google accounted for the 9 most popular U.S. apps, as measured by penetration rates. Facebook has its core app (#1), Messenger (#3) and Instagram (#6), while Google has YouTube (#2), its Search app (#4), Google Maps (#5), Google Play (#8) and Gmail (#9). It's safe to assume Facebook's WhatsApp, which claims over 1.2 billion monthly active users (MAUs), is in the top-5 in many international markets.
In addition, Facebook and Google have 4 of the 5 apps users are most likely to say they "cannot go without," and 8 of the 9 apps most likely to be placed on a phone's home screen. More on the other app later.
It's good to be Facebook.
Facebook and Google also claim a big chunk of total time spent on smartphone apps. Back in 2014, app analytics firm Flurry estimated that the companies were responsible for 35% of all app usage. comScore notes that the average consumer's most popular app accounts for 49% of all of his or her time spent on smartphone apps, and the second and third-most popular apps another 28%.
Quite often, the apps in question are from Facebook and Google. Though chances are that Snapchat is also frequently in the top-3 among younger U.S. consumers (not so much with older ones).
- App download rates continue to slow.
comScore reports 51% of users didn't download a single new app in June, up 2 percentage points from a year earlier. And among the 49% that did download something, nearly half downloaded only 1 or 2 apps. Also: The rates at which users discovered new apps for download via app stores, word-of-mouth or advertising all fell.
Fewer downloads of course mean fewer opportunities for Apple and Google to profit from app store transactions, whether via paid downloads, in-app purchases or subscriptions. On the other hand, low download activity, together with the fact that a majority of consumers use 20 or fewer apps each month, further strengthens the dominance of Facebook and Google's most popular apps.
And it gives developers more incentive to pay to drive downloads via Facebook, Google and Apple's app install ads. Facebook has long been the leader in this space, but Google, aided by ads appearing on Google Search, the Play Store and YouTube, has emerged as a strong #2 player.
- There's a big untapped opportunity to get older consumers to do more with their phones.
Not only do younger consumers spend more time on apps, they're also much more likely to download new apps, pay for apps, make in-app purchases and use 20-plus apps in a month. 70% of U.S. consumers aged 18 to 34 were reported to have made in-app purchases over the prior 12 months, with 46% making 5 or more purchases. For consumers aged 35 to 54, the numbers drop to 42% and 15%. And for those aged 55 and over, they're only at 28% and 5%.
Likewise, 36% of those aged 18 to 34 are reported to have bought 5 or more apps over the prior 12 months, compared with just 8% of those aged 35 to 54 and 3% of those 55 and over. And whereas 44% of those aged 18 to 34 use more than 20 apps per month, only 36% and 29% respectively do so in the higher age brackets.
For Apple and Google, just narrowing this demographic divide some could yield billions in additional app store revenue. Especially for Apple, given the App Store's continued monetization edge relative to Google Play. Apple got an $8 billion-plus revenue cut from App Store transactions in 2016, and reported its App Store revenue grew 40% annually in the March quarter. Double-digit growth in the iPhone installed base is playing a role, but so is growth in the number of App Store users paying for items and ARPU growth among existing payers.
- Amazon's core shopping app is gaining steam.
Though it didn't make comScore's top-10 list for most popular apps (maybe next year), 30% of U.S. smartphone users said they "cannot go without" Amazon.com core app, a figure that only trailed the core Facebook app's 37% and Gmail's 34%. Amazon was also the 4th-most-likely app to be placed on a phone's home screen, with 35% of surveyed users reporting they did so.
The numbers say a lot about how shopping on Amazon has become a way of life for many U.S. consumers -- especially for the estimated 50 million-plus households now signed up for Amazon Prime. Prime's momentum helped Amazon's North American segment revenue growth accelerate to 28% in Q2 from 22% in Q4 2016.
The growing tendency of consumers to head straight to Amazon's app to shop for items rather than search for them on Google is a long-term problem for Google's search ad business -- for now, Google is offsetting this by rapidly growing its ad sales to other online retailers. The trend is also a boon for Amazon's e-commerce ad business: Demand for ads placed on Amazon's site and apps was a big reason the company's "Other" reporting segment saw revenue rise 51% in Q2 to $945 million.
No comments:
Post a Comment