Thursday, 31 August 2017

Abandoning Multichannel Marketing Efforts in Favor of a ‘Mobile First’ Strategy

modernrestaurantmanagement.com

In the 1980’s, restaurants used just three marketing channels: phone, postal mail and print ads for promoting their brick and mortar stores. Rapid progress in consumer tech has brought many new opportunities to reach customers today, via new personal mobile devices and marketing channels, including email, websites, and mobile apps.  As consumers began to use multiple devices and different channels, restaurants faced the perplexing problem of how to make sure that all these channels communicate and complement each other to give people the smoothest experience. To meet the challenge, some businesses developed a multichannel marketing strategy.
The 2000’s Multichannel Marketing
The different channels in a multichannel approach include SMS text messages, email and postal mail, and even plastic cards as a customer loyalty and discount tool. As a part of this strategy, consumers use many different channels to connect with a brand. However, the channels are not combined and are utilized separately by restaurants, and sometimes by different teams. 
 
For example, a brand uses web-based ordering, sends emails and text messages, and then offers plastic loyalty cards. This approach has its obvious advantages, such as creating multiple interactions to reinforce a brand message. However, it requires a lot of effort from the marketing team to keep all the wheels turning. They need to orchestrate different marketing channels and micro-campaigns and synchronize all touch points with their customers to effectively engage them. Might there be a better way?  
It’s 2017: Time for a Mobile-First Focus
According to comScore’s recent Cross Platform Future in Focus report, in the U.S. the average adult (18+) spends two hours, 51 minutes on their phones per day. Many of today’s younger consumers, particularly Millennials and Generation Z, use their smartphones for almost everything — searching for nearby restaurants, looking through menus, checking reviews, hunting for special offers, making orders and payments. That is why restaurant owners want to get their messages front and center with the smartphones their customers have in their hands.
 
Instead of using multiple marketing channels, brands can converge to mobile, and switch to a “all in one” mobile app solution. Businesses in the quick-service restaurant industry have started following the mobile trend and are launching their own apps, realizing that a well-planned mobile strategy can help them boost company’s profits through more effective customer engagement that they can track.
The Power of the Integrated Mobile App Channel
In case you are not sure why it’s worth making mobile your primary customer communication channel, instead of using multiple marketing channels for different goals, here are six benefits of going down the path of mobile-first focus.
'The Brand in their Hand'
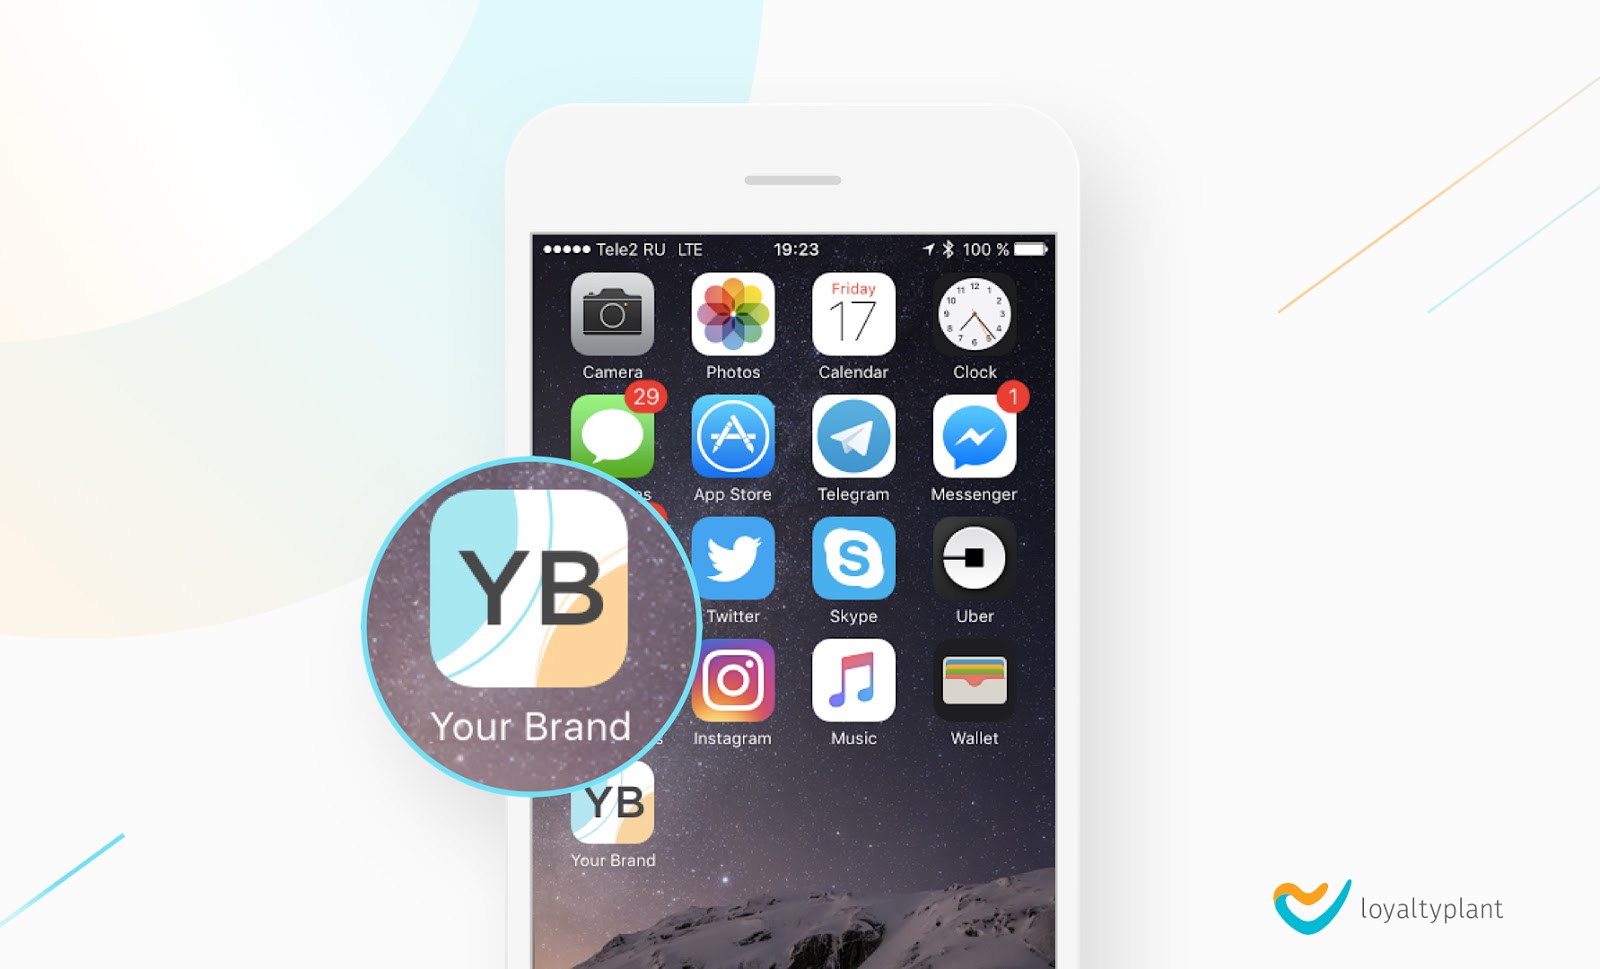
Everybody has a smartphone, and they bring it with them, making it a highly personalized tool. With a mobile app installed on your customer’s phone, you can have the “brand in their hand.” In terms of brand awareness, an app is more efficient, as compared to the a website, because it provides the easiest way of exposing consumers to your brand at least once a day. People may not even use your app every single day, but as long as they have your app installed, it serves as a constant reminder of your brand, since they see your app icon almost every time they use their smartphones.
Right Message, Right Time, Right Place
Only a mobile app provides marketers with the opportunity to connect with their customers at the right time, in the right place, via the individual message. If done right, push messaging can lead to 10-50 percent conversion from your hyper-targeted campaign. With push messages, you can inform your guests about special offers in your restaurant, send them birthday greetings, and offer some incentives, encouraging them to visit your place.
 
According to the survey done by Responsys, nearly 70 percent of consumers enable push notification from their favorite brand’s apps. With web-based communication, emails are often read at the wrong time. What is more, mobile apps have opened new frontiers in location-based marketing. Due to geo targeting, you can communicate with your customers based on their geolocation.
Data Collection
A mobile app allows you to collect priceless data about your customers to get insights into their demographics, behavior, habits, and preferences. With this wealth of information you can segment your guests and send them targeted messages. With an integrated mobile app solution, all data is collected in one place, eliminating the need to synchronize all data that is acquired from many channels.
New Stream of Conversions
Mobile apps provide a great medium to push users down the conversion funnel. As mobile apps allow to run more targeted campaigns, marketers can use apps to tap specific users in the funnel. In the retail industry, app mobile shoppers are more engaged and are more likely to convert than web-based users. According to Criteo’s Q4 2015 State of Mobile Commerce Report, app-conversion rates were 120 percent higher than mobile browser conversions and 20 percent higher than desktop conversions. Restaurant owners can take advantage of an app-centric mobile strategy as well. By implementing an in-app ordering feature, you can provide a more convenient experience to your guests and enable them to make orders on the go. Consumers who make orders online tend to purchase more, since they have more time to decide.  
The True Value of Loyalty
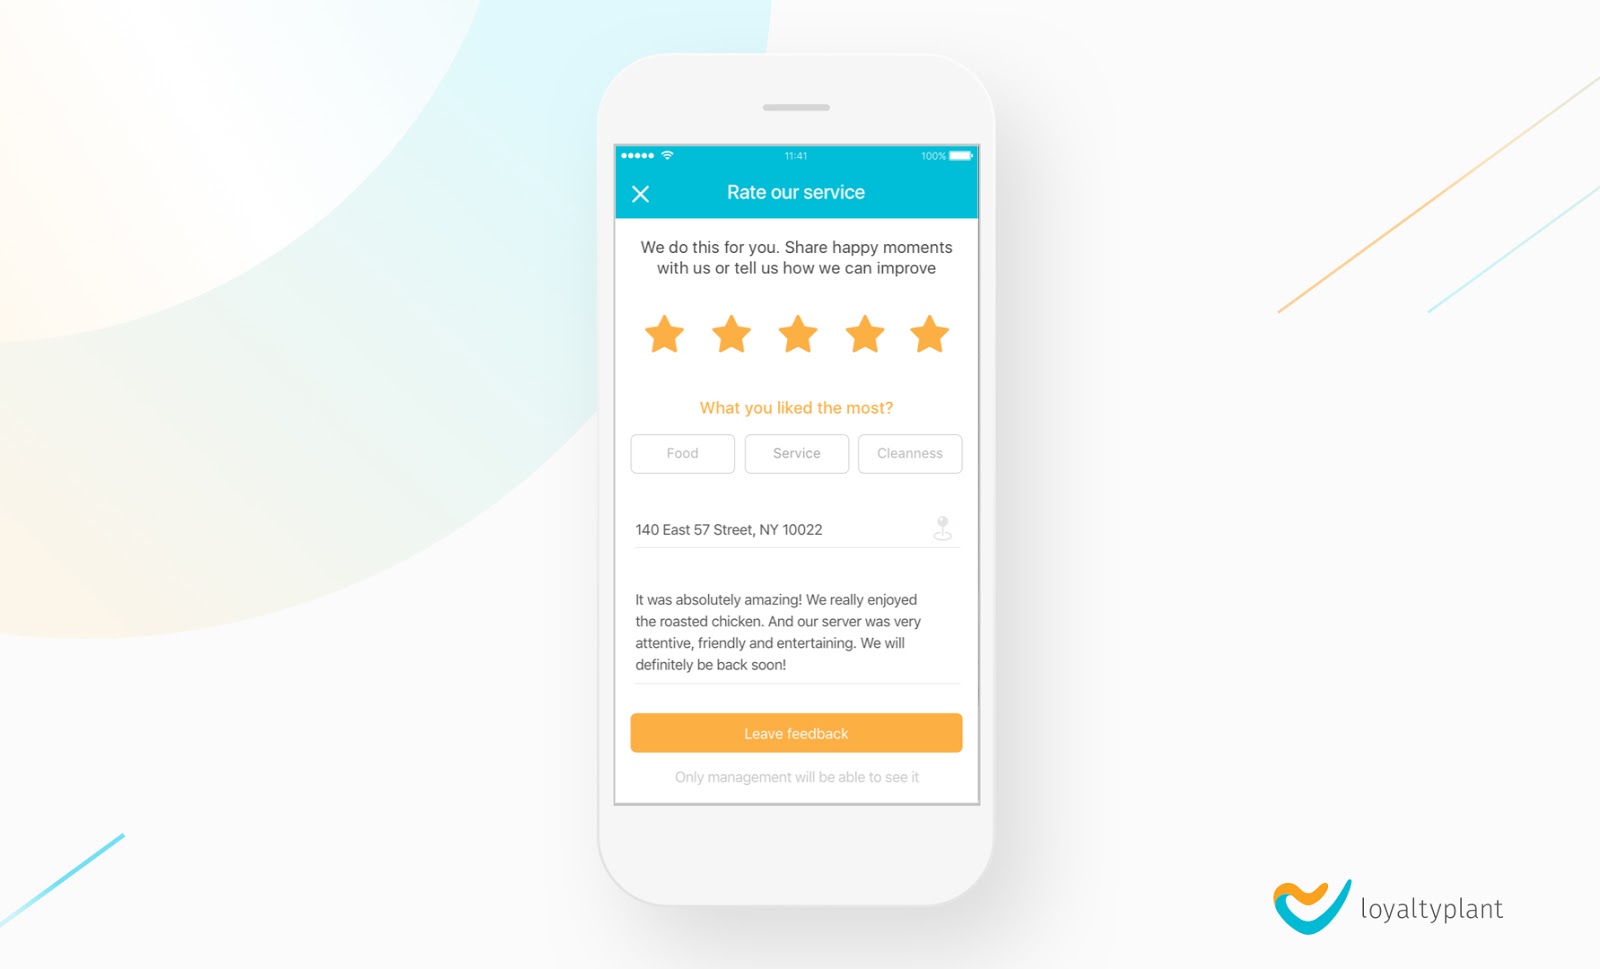
With all that noise out there, including flyers, coupons, billboards, website banners, social media ads, and emails, businesses are losing their influence on customers who have very low patience and short attention span. Therefore, it can be very hard to reach out to them through the large amounts of advertising. On the other hand, most customers are welcoming mobile app loyalty programs. These programs don’t involve a time-consuming process of registration and take up additional space in your wallet, pocket, or purse, as opposed to plastic loyalty cards. Mobile app loyalty programs encourage your customers to spend more. Only a mobile app provides your guests with the easiest way to purchase items right after receiving the personalized reward. When a special offer is delivered via the push message to your client’s mobile app, they have it right at their fingertips and are just one click away from using this offer in-store.  
Social Sharing
You can integrate social media platforms into your restaurant’s app to collect more reviews that your happy customers leave. It’s a great opportunity to leverage word-of-mouth marketing and accumulate social proof around your brand by getting people to share their positive experience on social networks. To encourage your guests to recommend your brand, you can give them additional rewards points for that. Also, you can add an ability to share content from your app news feed on social media directly from the app.
The Future of Mobile Apps
The explosive growth in the mobile app market isn’t likely to end. More restaurants are jumping on the mobile app bandwagon to make sure their guests have a convenient, fast, and pleasant experience, when making a purchase.A key advantage of a mobile-first strategy is that it allows for a consistent communication through just one channel, which is beneficial for both your customers and your restaurant. It is difficult to provide your clients with the same experience though different marketing entities. You need to make sure that every channel you use delivers a message that effectively engages your audience. Using multiple marketing channels lead to increased cost and difficulties of determining which channels and campaigns contributed to conversions and sales. On the other hand, with an integrated mobile app solution, restaurant owners don't have to spend a large amount of financial, time, and human resources to manage and coordinate different channels and measure the results. 

Recognize Your Super Users and Accelerate Your App Growth

influencive.com

Your best users provide your greatest source for reviews, growth and feedback.

Recognize Your Super Users and Accelerate Your App Growth
You have an app. You have users. Your analytics say you have some users that use your app a lot, others seem to try it once and then never return. But how do you recognize those best users and encourage them to use your app more often? This is where actionable segmentation comes in.
There are a lot of app analytic tools available for app developers. From Flurry to Google Analytics, you have plenty of tools to show you how often your app is opened, clicked or used, but not many ways to make actionable decisions or actions from that data within your app. For app developers, there really are only a few key metrics that really work for recognizing user behavior and providing easy tools for adding incentives for better engagement. Those metrics are almost the same as retail stores have used for years to segment their customers.
Who knew that my time selling comic books would directly help me with app development?
When I was in retail, we used two metrics to categorize our customers and find incentives to make them our super customers.  Because I was in the comic business, ‘super’ was an appropriate term for our best customers.
Our super customers showed up at 2 am to buy the latest Magic the Gathering release. They’d come in every week, remembering our last conversation, helping unbox product on new comic day. They would passionately share their favorite new comic with their friends and relatives and complete strangers in the store, and even tell them to buy it at our store. They purchased from our stores first before going to a secondary source for something we didn’t have or couldn’t get. While the comic business is light years away from app development, the tools we used are highly applicable to today’s app marketing.
In retail, the two key metrics are how often they shopped at the store and how much they spent. To measure that, we needed to know our averages, which just involved a lot of counting. Modern technology makes this so much easier.
Our average customer came into the store every two weeks and spent about $14 each visit. So customers who visited weekly and spent more than $14 were our Super customers. Simple, right?
With these two metrics, we now had four groups of customers, and we could create marketing plans for each group.
Group 1Here are our super customers. They keep the doors open and the lights on. We would have special events outside of business hours for them, put unique promo items aside for them that we knew they would like, or give them special discounts when available. These customers are special, and we treated them that way.
Group 2 Visited, more often than average, but spent less than average. These are the customers we saw as often as our Super customers, but they didn’t spend as much. To help get them into Group 1, we gave them coupons that would encourage them to spend more than average to get the discount. Because our average transaction was $14, we would give them a coupon for $10 off any purchase of $40 or more. And we could see them wandering around the store, adding things to their pile and adding it up in their head. But after they’d spend more than $14 several times, we didn’t need to give them the incentive anymore.
Group 3—Visited less often than average, but spent more each trip. Here, we wanted to get these customers to just come in more often so they might get a series of coupons that required each one to be used in sequence—such as one a week—over a period of time to get to the last and best coupon. Or we’d give them a coupon that couldn’t be used on the same day but had to be used within the next 7 days.
Group 4These were our general every-so-often customers. We wouldn’t try to get them from Group 4 to Group 1 right away. We would make a decision to try to encourage them first into either Group 2 or 3 first, before making the jump to Group 1. Either get them visiting more often or get them to spend more each visit. From there, you then move them into Group 1 using the above tools.
With this in mind, what metrics should an app developer use to find their Super Users?
Let’s start with average opening of the app and average time in the app—two easy to track metrics.
The App User Segmentation chart would look something like this:

Group 1These are your Super Users that open the app more often than average and spend more time in it than average. These are the users you want to focus on for app reviews, social sharing, promotions, and rewards. Most likely, they’re already sharing your app with their friends, so find more ways to encourage it and reward them.
Group 2These are opening your app more often, but spending less time in it. You should use them to find out why they have shorter app sessions and find ways to get them to stay in the app longer. Depending on your app, this can be anything from free coins at the end of a gameplay, extra targeted content, or anything that keeps them around just a little longer.
Group 3Here are your infrequent users that like using your app, but just don’t think about it as much. Here, you need to look for ways to bring your app back to the front of their mind—or the center of their home screen. App notifications, push messages or email all work to bring your app back to a user’s attention.
Group 4These are the bulk of the users that used your app once and deleted it or started to use it and stopped. Here, you want to find incentives to bring them back at least once or twice and see if you can move them into Group 2 or 3. They’re also a good potential source for surveys on why they didn’t use the app more than a couple of times.
How do you get this segmentation in your app and act on it? Most analytic tools don’t provide this. Instead, they focus on usage, but not on how to change engagement.
Enter AppToolkit.io’s super user and Cloud Config.
AppToolkit.io Super User Dashboard
Using the AppToolkit SDK, you can immediately start getting Super User data and see it live and create actions within the app to target those users. Instead of asking every user to leave you a review, only ask your Super Users. They’re more likely to do it and more likely to leave a positive 5-star review. Working on a new feature and want some helpful feedback? Ask your Super Users to either test it in-app, limiting it to just them or ask them to join a TestFlight build.
Once you can identify and interact with your apps Super Users, you can use them to grow your app faster. They’re more likely to review it, mention it in social media, promote it to their friends, and give you your best feedback.
Within the Super User dashboard, you can drill down to specific user history:
Super User Drilldown view
This user has had three sessions since the beginning of April, totaling 61.5 minutes. Right now, this app doesn’t do user registration, either voluntarily or required, but that’s easy enough to add. Once we include any form of user registration, we can then engage with this user within the app using the code on the side of the user dashboard. With the ability to see user devices, iOS, and app versions, you can tie that info into help ticket support or target specific users for updating to your latest version. Outside of that, using email to bring a user back to the app after an extended absence.
AppToolkit.io Super User is free for your first 1000 monthly average users and $0.001 cent per user over that. But finding your Super Users and growth hacking your reviews, downloads, and sales? That’s priceless. I’m sure there are other tools you can use as well. The point is to identify these users and analyze their behavior as quickly as possible to capitalize on the traction your app already has.

Wednesday, 30 August 2017

MarTech Landscape: What is predictive advertising?

martechtoday.com

The combination of big data and machine learning enables advertisers to efficiently expand their targeting efforts.


Predictive advertising is yet another area of marketing that is evolving rapidly thanks to the massive strides in the strain of artificial intelligence called machine learning and wide access to large sets of digital data.
In this installment of our MarTech Landscape series, we look at how predictive advertising works and how it’s commonly applied.

What makes predictive advertising predictive?

Predictive advertising is a subset of predictive analytics, also covered in our MarTech Landscape series. Predictive analytics uses machine learning to predict future outcomes based on behavioral patterns seen in historical data. Those predictions can be used for any number of purposes: understanding who is likely to pay off a loan, prioritizing leads most likely to close and so on. In this case, the predictions are used in ad targeting and media buying.
Machine learning is an application of artificial intelligence (AI). Machines are given access to large sets of data and coded to continually learn from the data in order to predict future actions with a high degree of certainty. With predictive analytics powering ad tech, campaigns can target audience segments based on a huge number of behavioral signals, ads can be personalized to be more relevant in the context of the user, and bids can be optimized based on user data — all faster and with higher success rates than humans can manually.
Predictive approaches can anticipate which user might respond to an ad based on a number of different attributes. As with any machine learning-based system, predictive advertising requires large amounts of data for the models to keep training and learning. The more data a system can pool across users and/or advertisers, the faster  and better the models can train and learn.

How is predictive advertising changing advertising?

There are several ways in which predictive advertising is being applied to traditional digital advertising tactics, including campaign optimization, media mix modeling, media buying and ad serving. Instead of relying on rule settings, machine learning models are applied to make decisions.
Prospecting or Pretargeting — Predictive advertising can help marketers cast a wider net beyond people or businesses they may have identified otherwise using limited data or — shudder — intuition. Predictive advertising can be used to identify and target new prospects with ads based on what is known about a company’s existing customers or visitors. Predictive advertising platforms can suck in structured data from numerous sources across multiple channels and marketing platforms to develop customer profiles. The systems can then identify and target users who fit those profiles with digital ads.
Lookalike and similar audience targeting offered by Facebook, Google, Twitter and other platforms are examples of predictive advertising applications. Lookalike and similar audiences are built from source audiences that can come from the advertiser, a data partner or the platforms themselves. The models identify other users that look like – have similar attributes and behaviors as — users in the seed lists.
Similarly, in-market audience targeting identifies users as they are deep in the research and buying process — way down the funnel — and enables advertisers to reach them with related messages in near-real time.
Private companies in this arena include AdRoll, which launched its prospecting engine in 2015 to pool advertisers’ first-party customer intent data to inform targeting. EverString has developed a predictive advertising platform to identify and target their B2B customers’ prospects with ads.
Retargeting — In typical retargeting, marketers can segment audiences based on the actions they took on their sites — visited product pages, abandoned a cart, made a purchase, downloaded a white paper and so forth. Predictive retargeting can add layers of data to map out customer intent signals beyond actions taken on their sites to provide much richer targeting capabilities.
Criteo Predictive Search employs machine learning to automate Google Shopping campaigns, including retargeting to “re-engage high-value users via behavioral targeting technology that programmatically sets bids based on each user’s propensity to make a purchase.”
Ad Mediation — Tapjoy applies predictive analytics to optimize ad serving for app publishers. To ensure app publishers don’t miss out on potential in-app purchase revenue, Tapjoy uses predictive systems to identify users who are likely to make in-app purchases. It serves marketing messages to those users, and ads to the larger majority the system predicts won’t make an in-app purchase.
Campaign optimization — Predictive bidding algorithms can adjust in real time based on what the system knows about the session user. For example, Google and Bing Ads both offer conversion- and click-based bid strategies in which bids are adjusted based on the users’s predicted propensity to click or convert.
Performance Horizon has a campaign performance prediction tool baked into its platform for publishers to manage affiliate and partner programs. Using historical data from at least 30 days of a campaign, the platform selects one of five different prediction models as the most appropriate for each client. It predicts sales and commissions based on a current campaign and can identify anomalies.
Adobe has been incorporating predictive analytics into its media-buying tools for several years, including media mix planning. Forecasting models in Adobe Media Optimizer predict campaign performance and automatically adjust accordingly. QuanticMind bills itself as a predictive advertising management platform that uses artificial intelligence to analyze dozens of data sets and optimize search and social campaigns based on what the system predicts will be drive the best outcomes.

What does predictive advertising look like?

Here’s a visual from Quantcast illustrating how the company has adapted its systems to enable real-time predictive bidding.
Tens of thousands of models are available in real time from the “Model Store.” The “Real Time Featurizer” collects real-time behavioral data and translates the data into a format the machines can read. Quantcast’s “Keebler” is like a cookie data warehouse from which all of the anonymous user IDs are served — fast.
Source: Quantcast
Having immediate access to models and behavioral data enables the system to identify relevant audiences and make real-time bidding decisions based on a user’s predicted interest in a particular product or service.
With the evolution of machine learning’s integration into ad tech systems, it’s now inconceivable to think of a day when predictive advertising is just called advertising.

Mobile App To Convert Readers To Subscribers

adexchanger.com

Engaged readers make for loyal subscribers.
The New York Times’ mobile app, which the publisher once feared would cannibalize its desktop subscriber rate, has proven to be the watering hole where many of the Times’ young, engaged readers hang out. Readers within the app rank among the most loyal and committed, in terms of the Times’ engagement metrics.
“The mobile app is an audience-centric experience,” said Bryan Davis, senior manager of audience marketing at the Times. “It’s a slightly easier reading experience, it’s fast, and viewing and listening in the app is more intuitive. We know that all these moments are closely tied with subscription propensity.”
Readers who install an app are 60% more likely than the Times’ most active web readers to subscribe within the next 60 days.
Davis’ team works to get more readers to try the app experience and then join the Times’ 2.3 million digital subscribers (out of a total of 3.3 million print and digital subscribers, as of Q2).
The Times markets its app by focusing on readers who are already consuming the Times’ via mobile web and social platforms like Facebook, Instagram, Twitter and Snapchat.
“We want to find people that have behaviors that cross over not only to engage with the app, but install it in the first place,” Davis said. “Installation is a hurdle in the industry as a whole.”
The Times has found success with calls-to-actions that focus on installing the app instead of subscribing. Once the user installs the app, “the gateway [or paywall] is a big conversion moment for us,” Davis said.. “And the likelihood to subscribe [after the paywall] is higher than what we typically see on desktop and mobile web,”
The mobile app helped the Times connect with younger potential subscribers. Since the November election, readers 18-24 have accounted for 14% of new monthly app installs, Davis said.
The Times markets to this demographic on the platforms where they’re more comfortable, and it uses softer messaging. On Instagram, for example, it doesn’t use calls-to-actions encouraging the user to subscribe right away.
“A subscription message might not be the first thing we want to show those readers, because as a younger subscriber they have a different conversion rate,” Davis said.
When it comes to driving app installs, Facebook Messenger has been a breakout hit, recently surpassing Facebook proper as the most efficient channel to reach college students.
On Facebook Messenger, readers are 30% more likely to click through app store pages and install Times products than average.
On Snapchat, where the Times started posting content in April, the publisher is exploring ways it can incorporate app-install ads – but it hasn’t started advertising there yet.
Many of these platforms have made it easier to run app-install campaigns in recent years, but that has also increased advertising costs. The Times hasn’t seen costs spiral the way games or freemium apps have, Davis said, in part because it’s always focused on marketing to a high-quality reader.
“We are less focused on scale and more on the quality of reader that we reach,” Davis said.
Using a marketing approach focused on attracting a quality reader is showing signs of paying off in terms of lifetime value.
Readers tend to consume longer stories and read across multiple different sections more than other readers, so they value their subscriptions more. And the Times is reaching a generation of younger readers who may subscribe for years to come.
“The retention rate for annual app subscribers is the highest of any of our subscription offerings,” Davis said.

Tuesday, 29 August 2017

Why it's time to start paying for software again

techrepublic.com
How many free apps do you have on your device? Would you considering paying for them? Jack Wallen lays out why it's time for consumers to start shelling out a buck or two for mobile apps.
moneyhero.jpg
My wife and I were walking through a mall over the weekend and I reminded her (probably for the 50th time) that I once worked at Software Boutique in that particular mall and that the company used to sell the Netscape Navigator browser on disks for about 20 bucks. That was back in the mid 90s, when the only free software (that wasn't open source) came in the form of AOL CDs. You wanted software (again, that wasn't open source), you paid for it. Yes, there were shareware programs available, but most of the time those programs were nothing more than limited samples or apps like Winamp.
Consumers understood this model. They knew (or assumed) companies worked hard to produce software and, to that end, they helped to keep the lights on for those companies by purchasing software.

That was then...

And then, around 1999, something really cool happened. A company, called Loki Entertainment, came out with Linux ports of popular games. I remember playing the Myth II: Soulblighter game for the first time on the Linux platform and it was wonderful. I purchased every one of their games—even those I wouldn't play—just to help the cause. But it wasn't enough. You see, Linux users were already accustomed to having all the software they needed for free. So why would they bother paying for games?
Because of that (and a terrible miscalculation with Quake III: Arena), Loki Entertainment went under and there were no more Linux ports of popular games. This was a blow to the Linux community, as it was a certainty that, along with playable games, world domination for the desktop would soon follow. Unfortunately, the people's dollar had spoken and it wasn't meant to be.
This is now
Fast forward to today and the consumer has been retrained. Thanks to the advent of the smartphone and app stores, users have forced developers into what I call a "race to zero." That is, most consumers are willing to pay zero for the software they use and developers have to respond to that by giving their work away for free.
And why not? Most of the apps on the app stores are free—so the precedent was set. Unfortunately, as we have seen with other models, that creates a deluge of really bad software. We're talking apps that are poorly designed, poorly coded, poorly executed. This has also done a great job of enabling malware. Since there is so much software for free, people aren't hesitant (even when you warn them to be) to load up apps, willy nilly, on their devices.
It's free! Why not?
But here's the thing, something every consumer must understand
Developers, companies, and individuals all work very hard creating those applications. In some cases, we're talking startup companies attempting to live the dream by making a living at doing what they love. When the consumer refuses to pay for software, it's not only a slap in the face to developers, it's also a threat to their livelihood.
This very same model is occurring in other markets. Books, music, movies—they're all suffering from this same race to zero.
And yes, there are other ways for developers to make a buck. Placing advertising in their applications can help them create a revenue stream where there once wasn't one. Advertising dollars (at least on the app front) can actually generate a decent income. According to Emarketer, mobile ad spending is expected to increase from about $9.6 billion in 2013 to $35.6 billion in 2017, when it will exceed spending on desktop ads for the first time. But those ads only work if consumers are actually using those apps regularly.
Developers understand this. In fact, in today's market, developers know they can make more money with free apps that include advertising, versus selling paid apps. Why? Consumers aren't buying apps. And yet, consumers have grown tired of seeing advertisement within apps, which is why app blockers have become so popular.

A lose-lose scenario

Where is the breaking point for this lose-lose scenario? When developers have to include advertisements in their apps (to keep the lights on) and consumers go out of their way to block said advertisements? The ideal end game would be consumers leaving behind the modern mindset and returning back to that period where most software had a price tag. I'm not saying we go back to a time when a browser cost the consumer $19.99; but a price range of a buck to five bucks sounds pretty reasonable—especially considering how much we use/depend upon that software.
I also understand there are so many moving pieces to this machine—but, in the end, if developers are going to continue to do what they do (especially within the mobile landscape), they must be able to turn a profit for their work. Otherwise, what is the justification for spending all that time bringing their brilliant idea to life?

The easiest "immediate" solution

There is patch that can be applied to this situation, one that will help a bit...for now. Consumers, I would say this: If you find a free app you like, one that includes in-app purchases for added features or to get rid of advertisement, pay that particular piper. Get in the habit of shelling out a cool buck or two to the developer of the app you use every day to let them know you appreciate their work. Hopefully you contribution will help that developer eat a sandwich that day.

5 Key Takeaways for Apple, Google and Others From the Latest Mobile Stats

realmoney.thestreet.com
Image result for smartphone app usage
Though rosy stats from the likes of Apple, Alphabet and Facebook Inc. about their mobile user and/or revenue growth can make it seem as if smartphone app usage is a runaway freight train, things are a little more complicated when you take a birds-eye view of the proverbial "app economy," as research firm comScore just did in its latest report on U.S. mobile app usage.
As comScore's numbers show, some mobile trends look much stronger than others, and some are healthy for certain demographics and weak for others. Here are some important takeaways for publicly-traded tech and Internet companies.
  1. Smartphone apps are in a league of their own when it comes to time spent.
comScore's data indicates smartphones accounted for 57% of all U.S. digital media time spent in June, with smartphone apps accounting for 50% and smartphone web browsing 7%. PCs now account for just 34% of time spent, and tablets just 9%. On average, U.S. consumers now spend 2.3 hours per day using apps, with younger demographic groups spending more time and older ones less.
It's worth adding that smartphones likely make up an even larger percentage of digital time spent in foreign markets where PC home and work penetration rates are lower. That said, PCs still account for a pretty large percentage of time spent on certain activities, such as online shopping and watching longer videos.
  1. Facebook and Google's most popular apps are as dominant as ever.
With the exception of Snap Inc.'s (SNAP)  Snapchat, which came in at #7, Facebook and Google accounted for the 9 most popular U.S. apps, as measured by penetration rates. Facebook has its core app (#1), Messenger (#3) and Instagram (#6), while Google has YouTube (#2), its Search app (#4), Google Maps (#5), Google Play (#8) and Gmail (#9). It's safe to assume Facebook's WhatsApp, which claims over 1.2 billion monthly active users (MAUs), is in the top-5 in many international markets.
In addition, Facebook and Google have 4 of the 5 apps users are most likely to say they "cannot go without," and 8 of the 9 apps most likely to be placed on a phone's home screen. More on the other app later.

It's good to be Facebook.
Facebook and Google also claim a big chunk of total time spent on smartphone apps. Back in 2014, app analytics firm Flurry estimated that the companies were responsible for 35% of all app usage. comScore notes that the average consumer's most popular app accounts for 49% of all of his or her time spent on smartphone apps, and the second and third-most popular apps another 28%.
Quite often, the apps in question are from Facebook and Google. Though chances are that Snapchat is also frequently in the top-3 among younger U.S. consumers (not so much with older ones).
  1. App download rates continue to slow.
comScore reports 51% of users didn't download a single new app in June, up 2 percentage points from a year earlier. And among the 49% that did download something, nearly half downloaded only 1 or 2 apps. Also: The rates at which users discovered new apps for download via app stores, word-of-mouth or advertising all fell.
Fewer downloads of course mean fewer opportunities for Apple and Google to profit from app store transactions, whether via paid downloads, in-app purchases or subscriptions. On the other hand, low download activity, together with the fact that a majority of consumers use 20 or fewer apps each month, further strengthens the dominance of Facebook and Google's most popular apps.
And it gives developers more incentive to pay to drive downloads via Facebook, Google and Apple's app install ads. Facebook has long been the leader in this space, but Google, aided by ads appearing on Google Search, the Play Store and YouTube, has emerged as a strong #2 player.
  1. There's a big untapped opportunity to get older consumers to do more with their phones.
Not only do younger consumers spend more time on apps, they're also much more likely to download new apps, pay for apps, make in-app purchases and use 20-plus apps in a month. 70% of U.S. consumers aged 18 to 34 were reported to have made in-app purchases over the prior 12 months, with 46% making 5 or more purchases. For consumers aged 35 to 54, the numbers drop to 42% and 15%. And for those aged 55 and over, they're only at 28% and 5%.
Likewise, 36% of those aged 18 to 34 are reported to have bought 5 or more apps over the prior 12 months, compared with just 8% of those aged 35 to 54 and 3% of those 55 and over. And whereas 44% of those aged 18 to 34 use more than 20 apps per month, only 36% and 29% respectively do so in the higher age brackets.
For Apple and Google, just narrowing this demographic divide some could yield billions in additional app store revenue. Especially for Apple, given the App Store's continued monetization edge relative to Google Play. Apple got an $8 billion-plus revenue cut from App Store transactions in 2016, and reported its App Store revenue grew 40% annually in the March quarter. Double-digit growth in the iPhone installed base is playing a role, but so is growth in the number of App Store users paying for items and ARPU growth among existing payers.
  1. Amazon's core shopping app is gaining steam.
Though it didn't make comScore's top-10 list for most popular apps (maybe next year), 30% of U.S. smartphone users said they "cannot go without" Amazon.com core app, a figure that only trailed the core Facebook app's 37% and Gmail's 34%. Amazon was also the 4th-most-likely app to be placed on a phone's home screen, with 35% of surveyed users reporting they did so.
The numbers say a lot about how shopping on Amazon has become a way of life for many U.S. consumers -- especially for the estimated 50 million-plus households now signed up for Amazon Prime. Prime's momentum helped Amazon's North American segment revenue growth accelerate to 28% in Q2 from 22% in Q4 2016.
The growing tendency of consumers to head straight to Amazon's app to shop for items rather than search for them on Google is a long-term problem for Google's search ad business -- for now, Google is offsetting this by rapidly growing its ad sales to other online retailers. The trend is also a boon for Amazon's e-commerce ad business: Demand for ads placed on Amazon's site and apps was a big reason the company's "Other" reporting segment saw revenue rise 51% in Q2 to $945 million.

Monday, 28 August 2017

Half of digital time is spent in smartphone apps

warc.com
Image result for smartphone apps
Smartphone apps account for half (50%) of the digital media time that US adults spend online, followed by desktop (34%), with tablet and mobile web rounding out the remaining 16%, a new study has found.
But in a sign of just how much younger consumers have embraced mobile, the latest US Mobile App Report from measurement firm comScore, found two-thirds (66%) of those aged 18 to 24 now spend their digital time in smartphone apps compared with just 23% who spend their time on desktop.
Meanwhile, just 27% of Americans aged 65+ spend their digital time in smartphone apps, with more than half (53%) preferring desktop. Even among millennials aged 25 to 34, smartphone apps account for little over half (54%) of their share of platform time.
According to analysis of the findings by Marketing Land, this data contains “clear audience targeting implications” along with comScore’s finding that the “duopoly” of Facebook and Google own as many as eight of the top ten apps in the US.
Facebook’s main app is the most popular, reaching 81% of all app users – although YouTube is the top app among 18-to-24-year-olds – while Facebook Messenger and Instagram come in at third and sixth respectively.
Google-owned apps account for five of the top ten apps, including YouTube (#2), Google Search (#3), Google Maps (#4), Google Play (#8) and Gmail (#9).
The only non-Google and non-Facebook apps in the top ten are Snapchat (tied at #6 with Instagram at 50% penetration) and Pandora (#10 with 41% penetration), reported Recode.
However, Snapchat is clearly more popular among younger users as it ranks third among those aged 18 to 24, and sixth among consumers aged 25 to 34.
Interestingly, comScore also found that a full 90% of users’ mobile app time is spent within a user’s top five apps. According to Marketing Land, that means just over 51% of all digital media time in the US is now spent within users’ top five mobile apps.

US government needs to rethink its approach to fighting ad fraud

thenextweb.com
by  
US government needs to rethink its approach to fighting ad fraud
With US digital ad spending set to reach $83 billion in 2017, an increase of 16 percent, the ROI for advertisers is threatened by fake clicks and views. Everyone in the ad ecosystem is affected, regardless of location. Ad Fraud is a global epidemic, crippling ad budgets and destroying trust in digital advertising.  
One suggested tactic has been to demand that traffic have a seal of approval from organizations that fight fraud, like the Trustworthy Accountability Group (TAG) , the Media Rating Council and the Joint Industry Committee for Web Standards in the UK and Ireland. But some of their policies, as currently defined, may not have the expected uplift on ad quality.  
For example, according to Section 4.4 of TAG’s Certified Against Fraud guidelines, a company must inspect all (100 percent) of its traffic to detect any potential bots. Sounds impressive, no? While this is an important first step in the right direction, compliance will be out of the reach for many digital advertising companies.  

All or nothing, leaves you with nothing

The time and money required to inspect all traffic actually becomes a barrier to cleaning up the ad game, and can actually have the opposite effect. While huge internet players have their own internally developed solutions to monitor traffic and the IT capacity for processing huge volumes of data, other players have leaner budgets with limited IT resources.  
Those companies that do comply will see their verification budgets stretched to the limit. So you wonder, what’s wrong with that? What this means is that companies can only perform a wide scale, superficial analysis of their traffic and this technique will not catch the more sophisticated scams. Fraudsters are aware of fraud detection measures, and can easily find ways to circumvent them. Doing only a superficial inspection of traffic will let fraudsters run rampant.  
For example, with the Traffic Alchemist scam, fraudsters bought junk traffic known for long viewing times, disguised the sites to appear reputable, cluttered the site with hidden pop-up ads and then cycled the traffic through site clusters to keep measurements within a normal range that wouldn’t raise suspicion.  
But what else can you do?
Verifying all of the traffic isn’t the only solution. Instead, I would suggest a strategy that consists of sampling micro-sets of ad traffic to reveal the trickiest of scams.
Analyzing a random subset of all data will uncover key clues in the larger data set, keeping the overall cost of inspection more affordable.  So for example, with a one percent margin of error and a 99 percent confidence level, one could analyze how many fake coins are in a shipment of 1,000,000 gold coins and do not have the proper weight. To do this, you only need to randomly sample 16,641 coins, reducing inspection costs significantly. By cutting down on the number of inspections you could allocate more resources to each inspection, actually catching the fraud.
Sampling for ad fraud detection is sufficient, because unlike cyberattacks, where immediate action is needed to prevent attacks from actually taking place, ad fraud is usually settled after the fact based on detection rather than prevention. This can lead to price negotiations for ad space or terminating the traffic source altogether. All the while actually helping bring awareness to the latest fraud techniques, helping everyone in the ecosystem.
By requiring 100 percent of the traffic to be verified for all players, we are back to square one. The ad world becomes split into two types of players: compliant companies with more expensive certified traffic and non-compliant players. Traffic that is not inspected will sneak in through the back door for those marketers looking to broaden the reach of their campaigns via more affordable channels.   
A better way forward for all would be to look at the right ratio of ad traffic that should be inspected by each player. This would give advertisers the best protection and guarantee clean traffic. In the end, more fraud can be detected if we make a shift to being practical and cost effective with our traffic analysis, and hopefully bring back trust in digital advertising.