The following collection of charts represents the most trusted research and the most recent data on major internet trends, by www.vpnmentor.com
While we’re dedicated to VPNs and online privacy issues, vpnMentor is also your resource for Internet trends and data.
As a result, we’ve scoured the most trusted research sites to present you with the following series of charts. Grouped by general topic, the information below represents the most recent data on major internet trends.
Feel free to share these statistics, whether the entire article or just a single graph, with attribution.
Global Internet Trends
Number of Websites in 2019
There are over 1.94 billion websites all over the world.
Web Growth Statistics
The fastest growing segment of the internet is the number of mobile social media users.
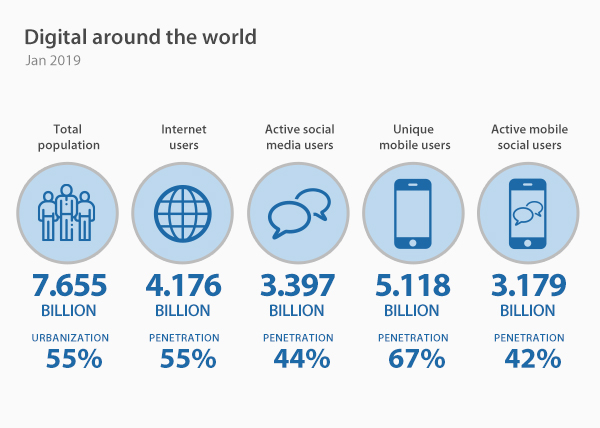
Mobile Internet Penetration
South Korea leads with 71.5% of the population who are mobile users.
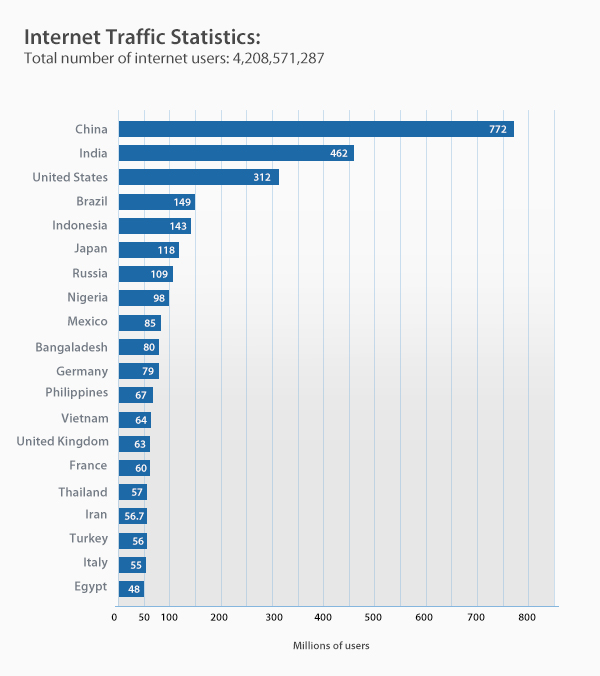
Internet Traffic Statistics
There are 4,208,571,287 internet users as of January 2019.
Asia accounts for almost half of the world’s internet users.
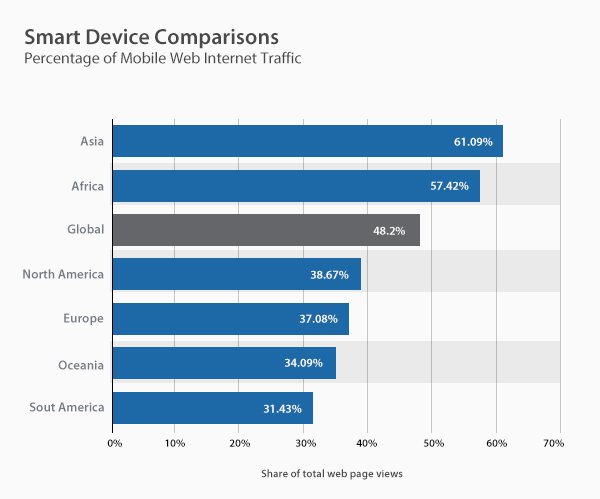
Smart Device Comparisons
Percentage of Mobile Web Internet Traffic
An astonishing 61.09% of Asia’s total web traffic comes from mobile devices.
Number of Smartphone Users
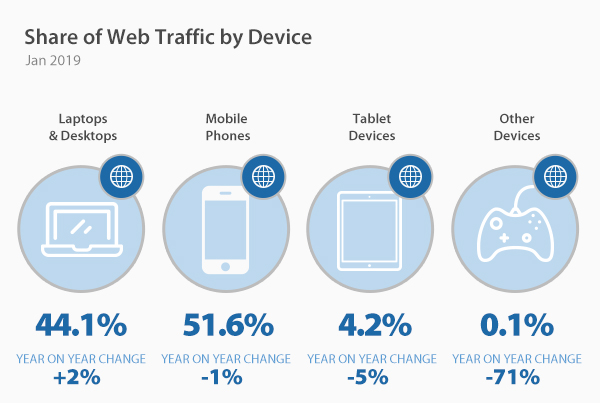
While several forecasts pegged 2014 as the “year of revolution” when mobile-only users would surpass desktop-only users, it turns out the forecast finally became reality in the U.S. in 2015. Since the start of 2017, mobile has surpassed desktop use and steadily remains so all the way through 2019, leading with 51.6%.
U.S. Platform Trends
As of 2019 there are 3.3 billion active smartphone users globally, with China and Asia Pacific forming more than one quarter of the total amount.

Tablet Internet Use
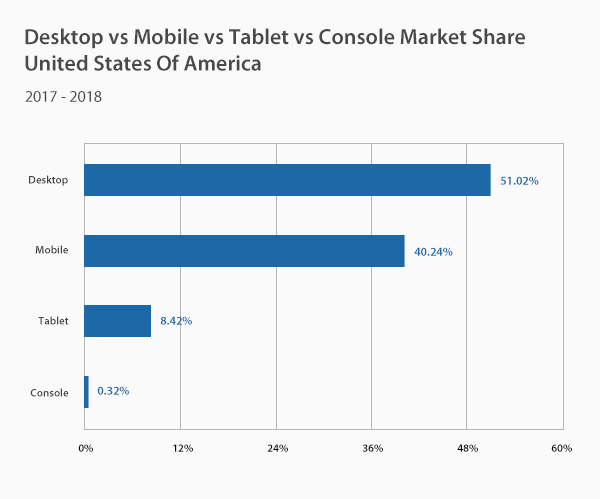
Tablet penetration has risen slowly over the past couple of years. Desktop accounts for 51.02%, mobile for slightly less, 40.24% and tablet for just 8.42% – an amount bound to soon begin decreasing with time.
Desktop vs Mobile vs Tablets in the U.K.
In the U.K., the number of people who use a desktop decreased from 54% to 51% in nearly a year. 
VPN Use
Of course, VPN use and data privacy have strong correlations. By accessing a separate server for internet use, VPNs make it much more difficult for hackers and third parties to track online activities. The following charts examine the current state of VPN use around the globe.
Top Markets for VPN Use
Since 2016 the VPN market has been experiencing continuous growth, reaching the sum of 23.6 billion U.S. dollars in 2019.

Website Performance
How Load Time Affects Web Page Abandonment
While web page features such as plug-ins, pop-ups, and streaming video may help convey your message, they hinder the page load time. As the following charts show, a page that takes longer than 3 seconds to load runs a high risk of abandonment.

Global Internet Speed Trend
Good news: internet speeds around the globe are at their highest peak ever with Singapore, Iceland, Hong Kong and Romania occupying top positions.

Search and Social Media
Worldwide Number of Social Media Users
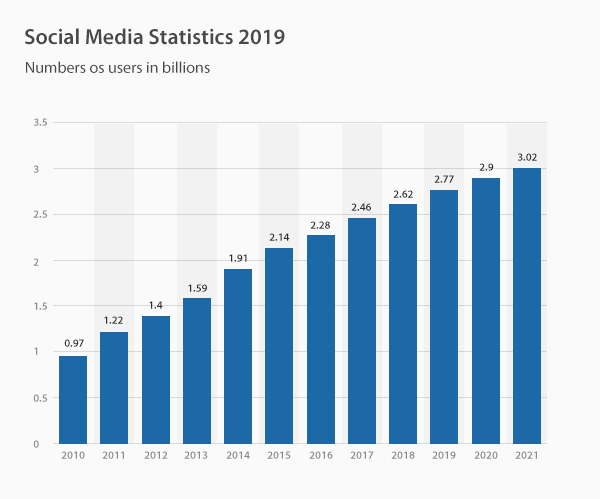
In 2019, the numbers of social media users reached 2.77 billion and is bound to peak to over 3 billion in 2021.
Most Popular US Social Media Platforms
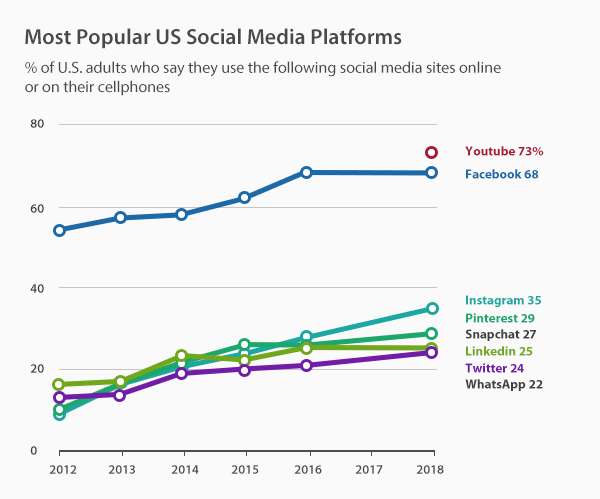
Youtube is the most used social media site on the internet – over 73% of US adults use it.
Content Management System Trends
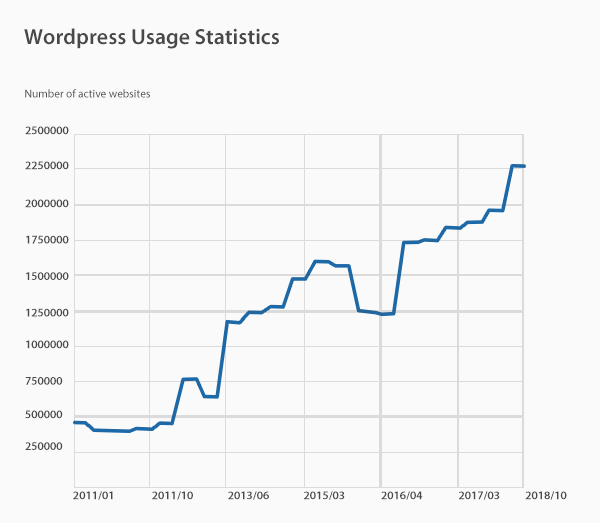
WordPress continues to win the content management market share with over 59.7%. The No. 2 system, Joomla, has a 6.7% market share.

Percentage of Internet Browser Users
In terms of web browsers used, Google Chrome continues to thrive. According to the latest numbers, it is more than 4 times as popular as its next closest competitor (Safari).

Percentage of Internet Time Spent on Search Engines/Social Media
The top three activities for Mobile device users in 2019: maps, instant messenger, and music.
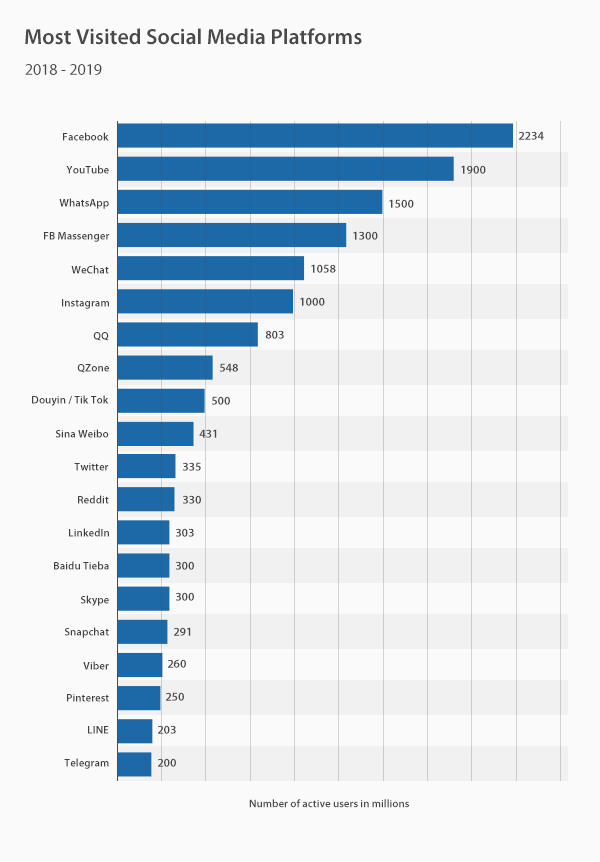
Percentage of Most Visited Social Media Platforms
Facebook takes the lead as the most visited social media platform with over 2.2 billion active users, followed by Youtube and WhatsApp.
Global and U.S. E-Commerce Trends
Statistics on Internet Research Before a Purchase by Age Group
People between 18-29 are the most likely to purchase a product online, while only a little more than half will research the product beforehand.
Facts and Statistics about Product Reviews
Think reviews are important? You’re right! 53% of shoppers read customer reviews before purchasing a product.
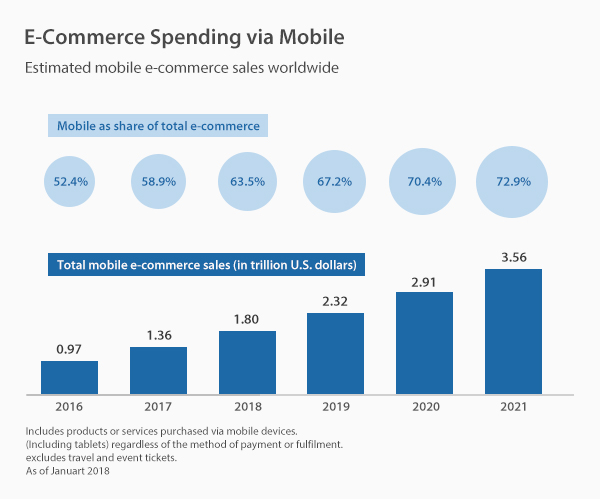
E-commerce Spending Via Mobile
When it comes to online purchasing, people purchase more on mobile in 2019 than they do on tablets or desktops.
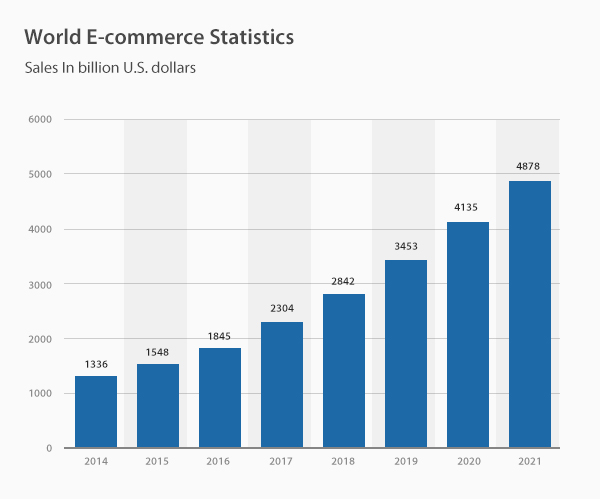
World E-commerce Statistics
E-commerce has experienced a steady increase in terms of sales, growing from 2,842 billion $ in 2018 to 3,453 billion $ in 2019.
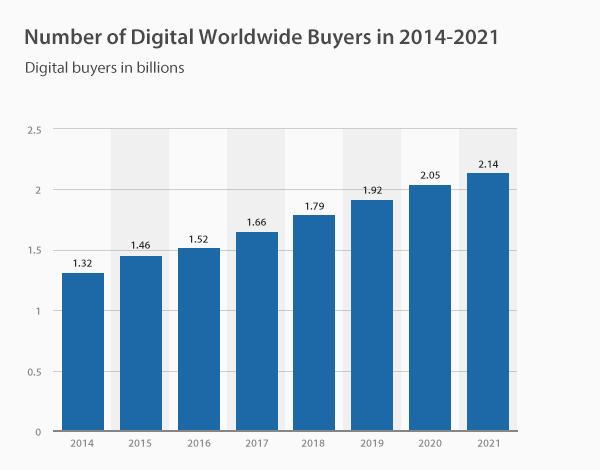
Digital Worldwide Buyers in 2019
The number of online buyers reached 1.92 billion in 2019 and is forecasted to bypass 2 billion in 2020.
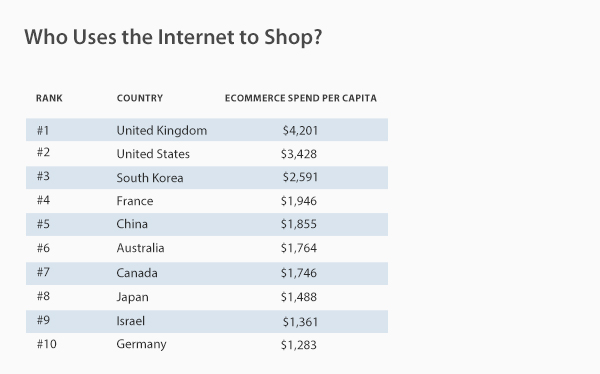
Who Uses the Internet to Shop?
The U.K. takes the lead for E-commerce spending per capita in 2019, followed by the United States and South Korea.
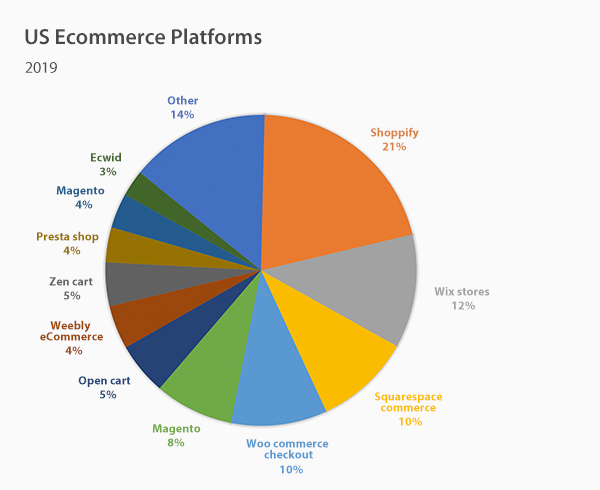
2019 U.S. and UK Online Shopping
In terms of U.S. and UK E-commerce, Shoppify has a leading market share of 21% in the U.S. and 14% in the UK.

Forecast and Trends for 2019 and Beyond
Currently, mobile users spend double the time in apps as they do on mobile web pages. In future years, this gap is expected to grow even wider.
Mobile App vs Mobile Web

Worldwide E-commerce Forecast
By 2021, global retail E-commerce sales are expected to approach $4.4 trillion.
Original Post: https://www.vpnmentor.com/blog/vital-internet-trends/


